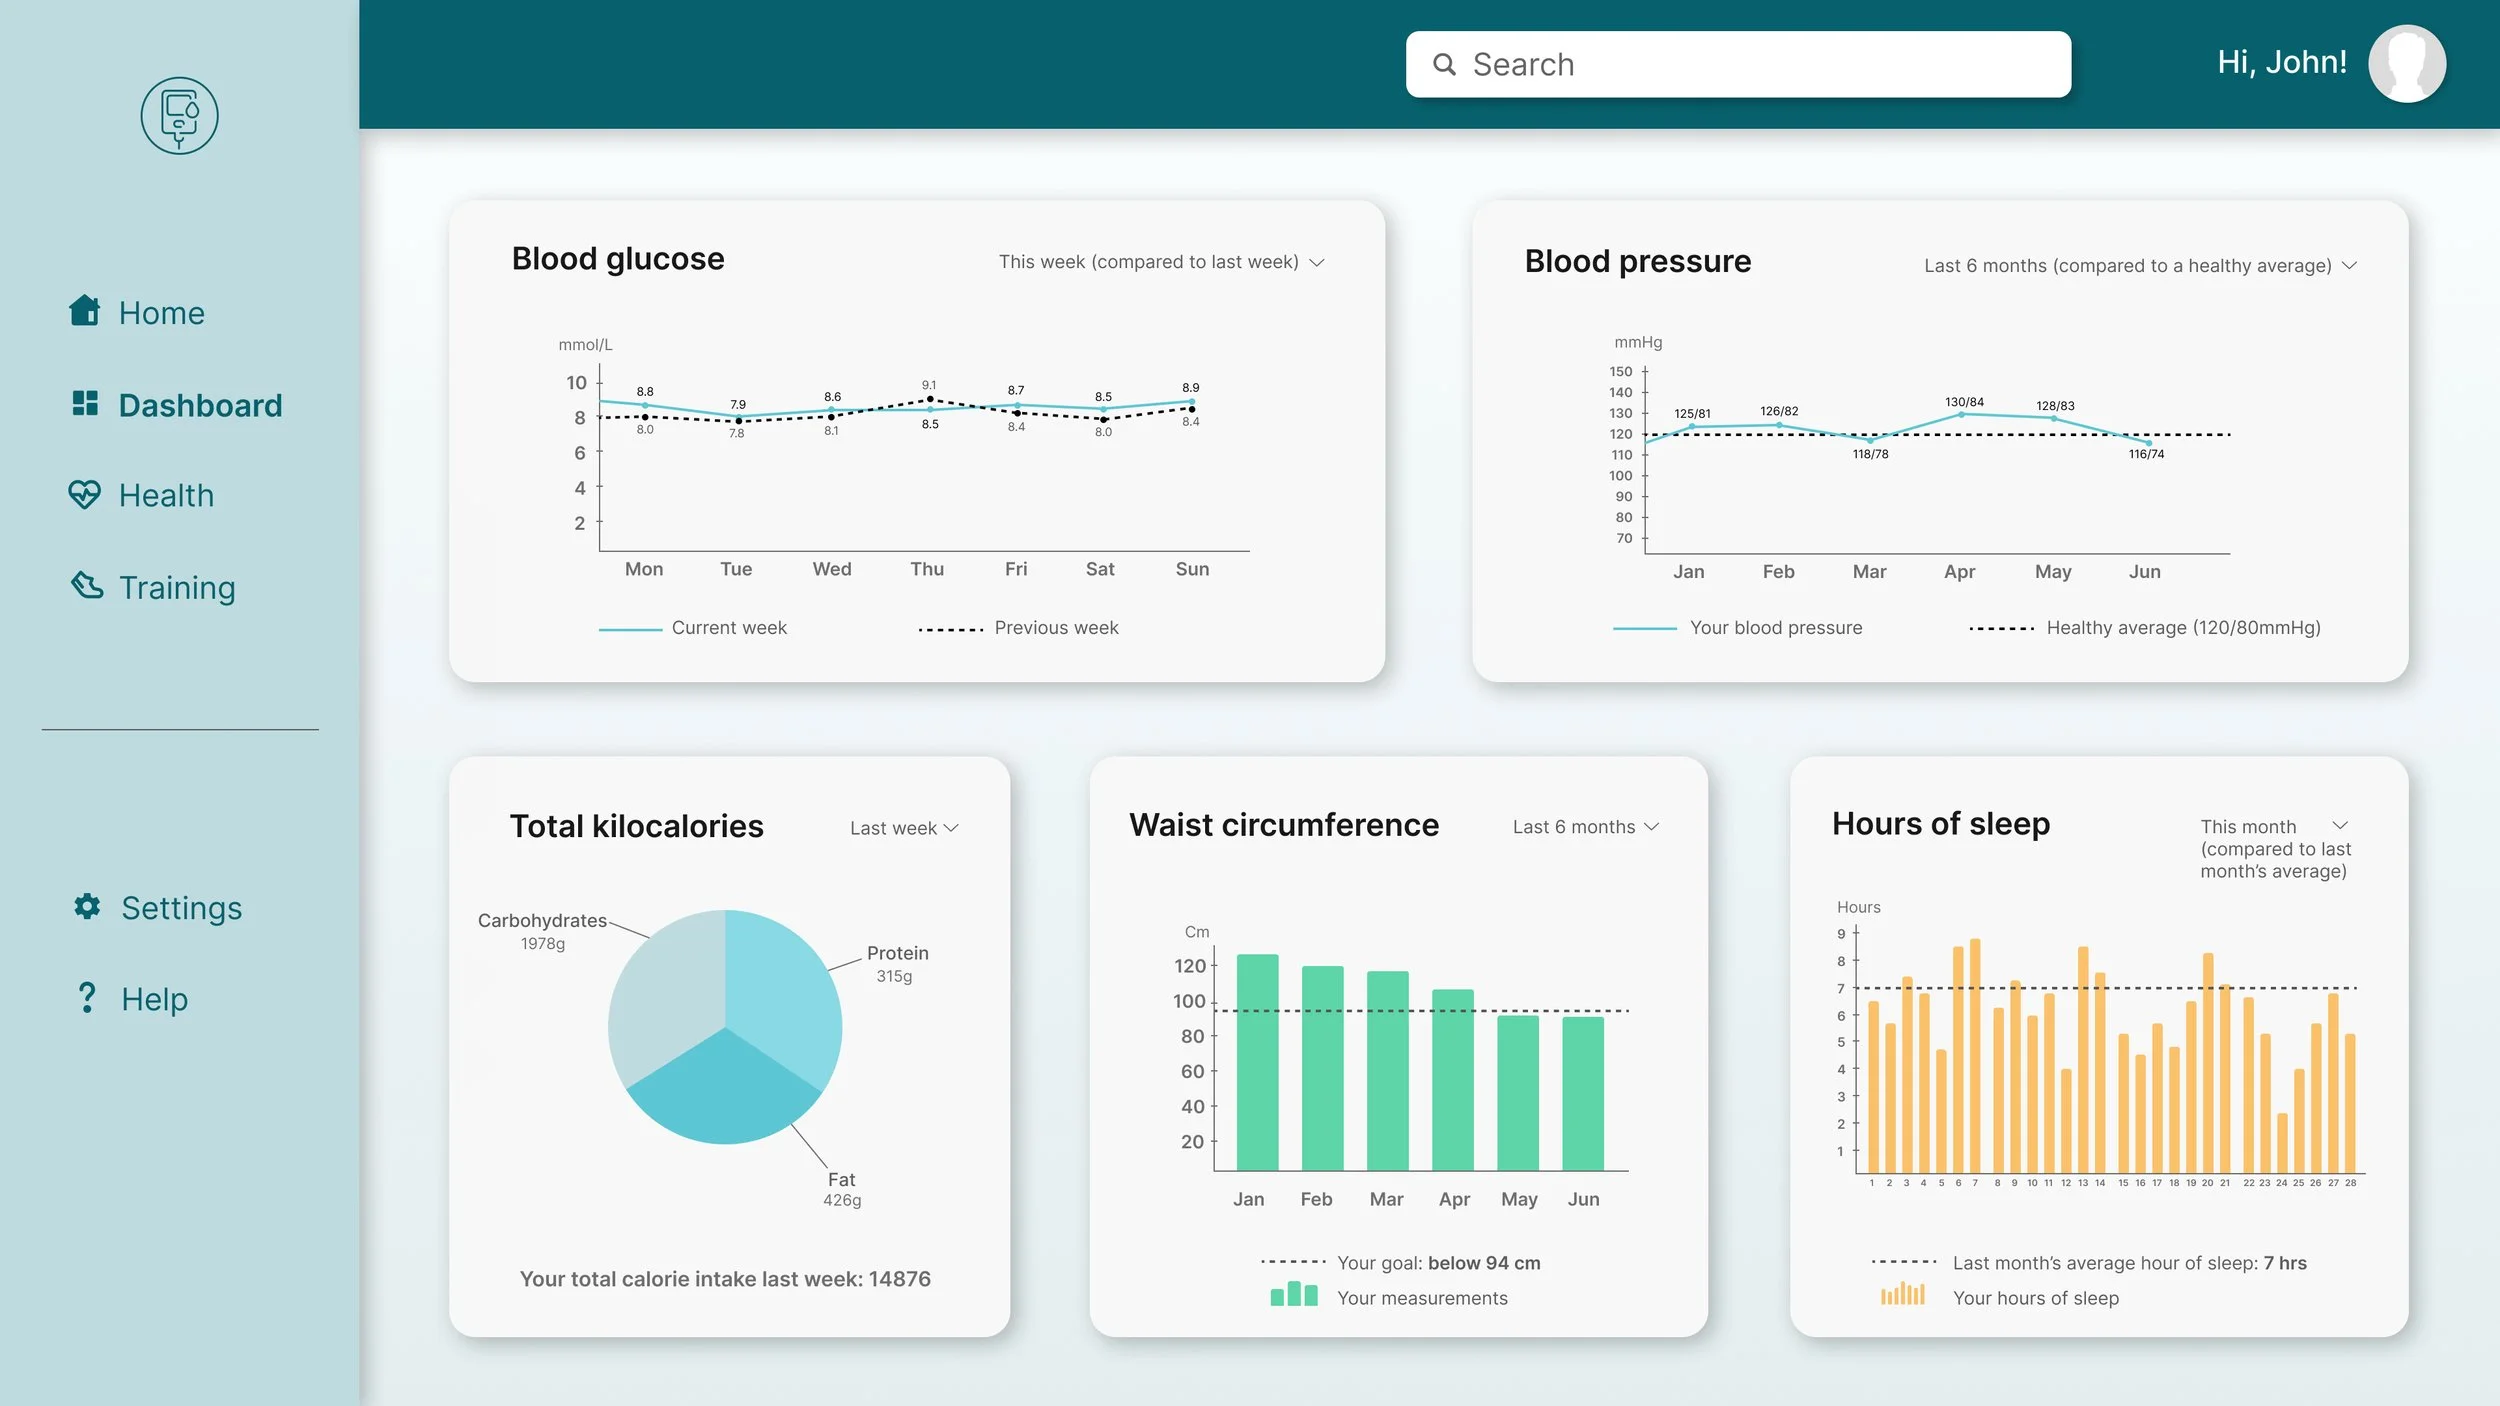
High-fidelity wireframe
This is a dashboard design I did as a school project, where we were tasked with creating a dashboard design for a health website that helps people who have diabetes track statistics about their health.
The purpose of the project was to learn more about data visualization and present data in a practical and meaningful way for the user.

Mid-fidelity wireframe
The dashboard presents data about users calorie intake and macronutrients, as well as historical data about the user’s health statistics such as waist circumference, sleep hours, blood pressure and glucose levels over time.
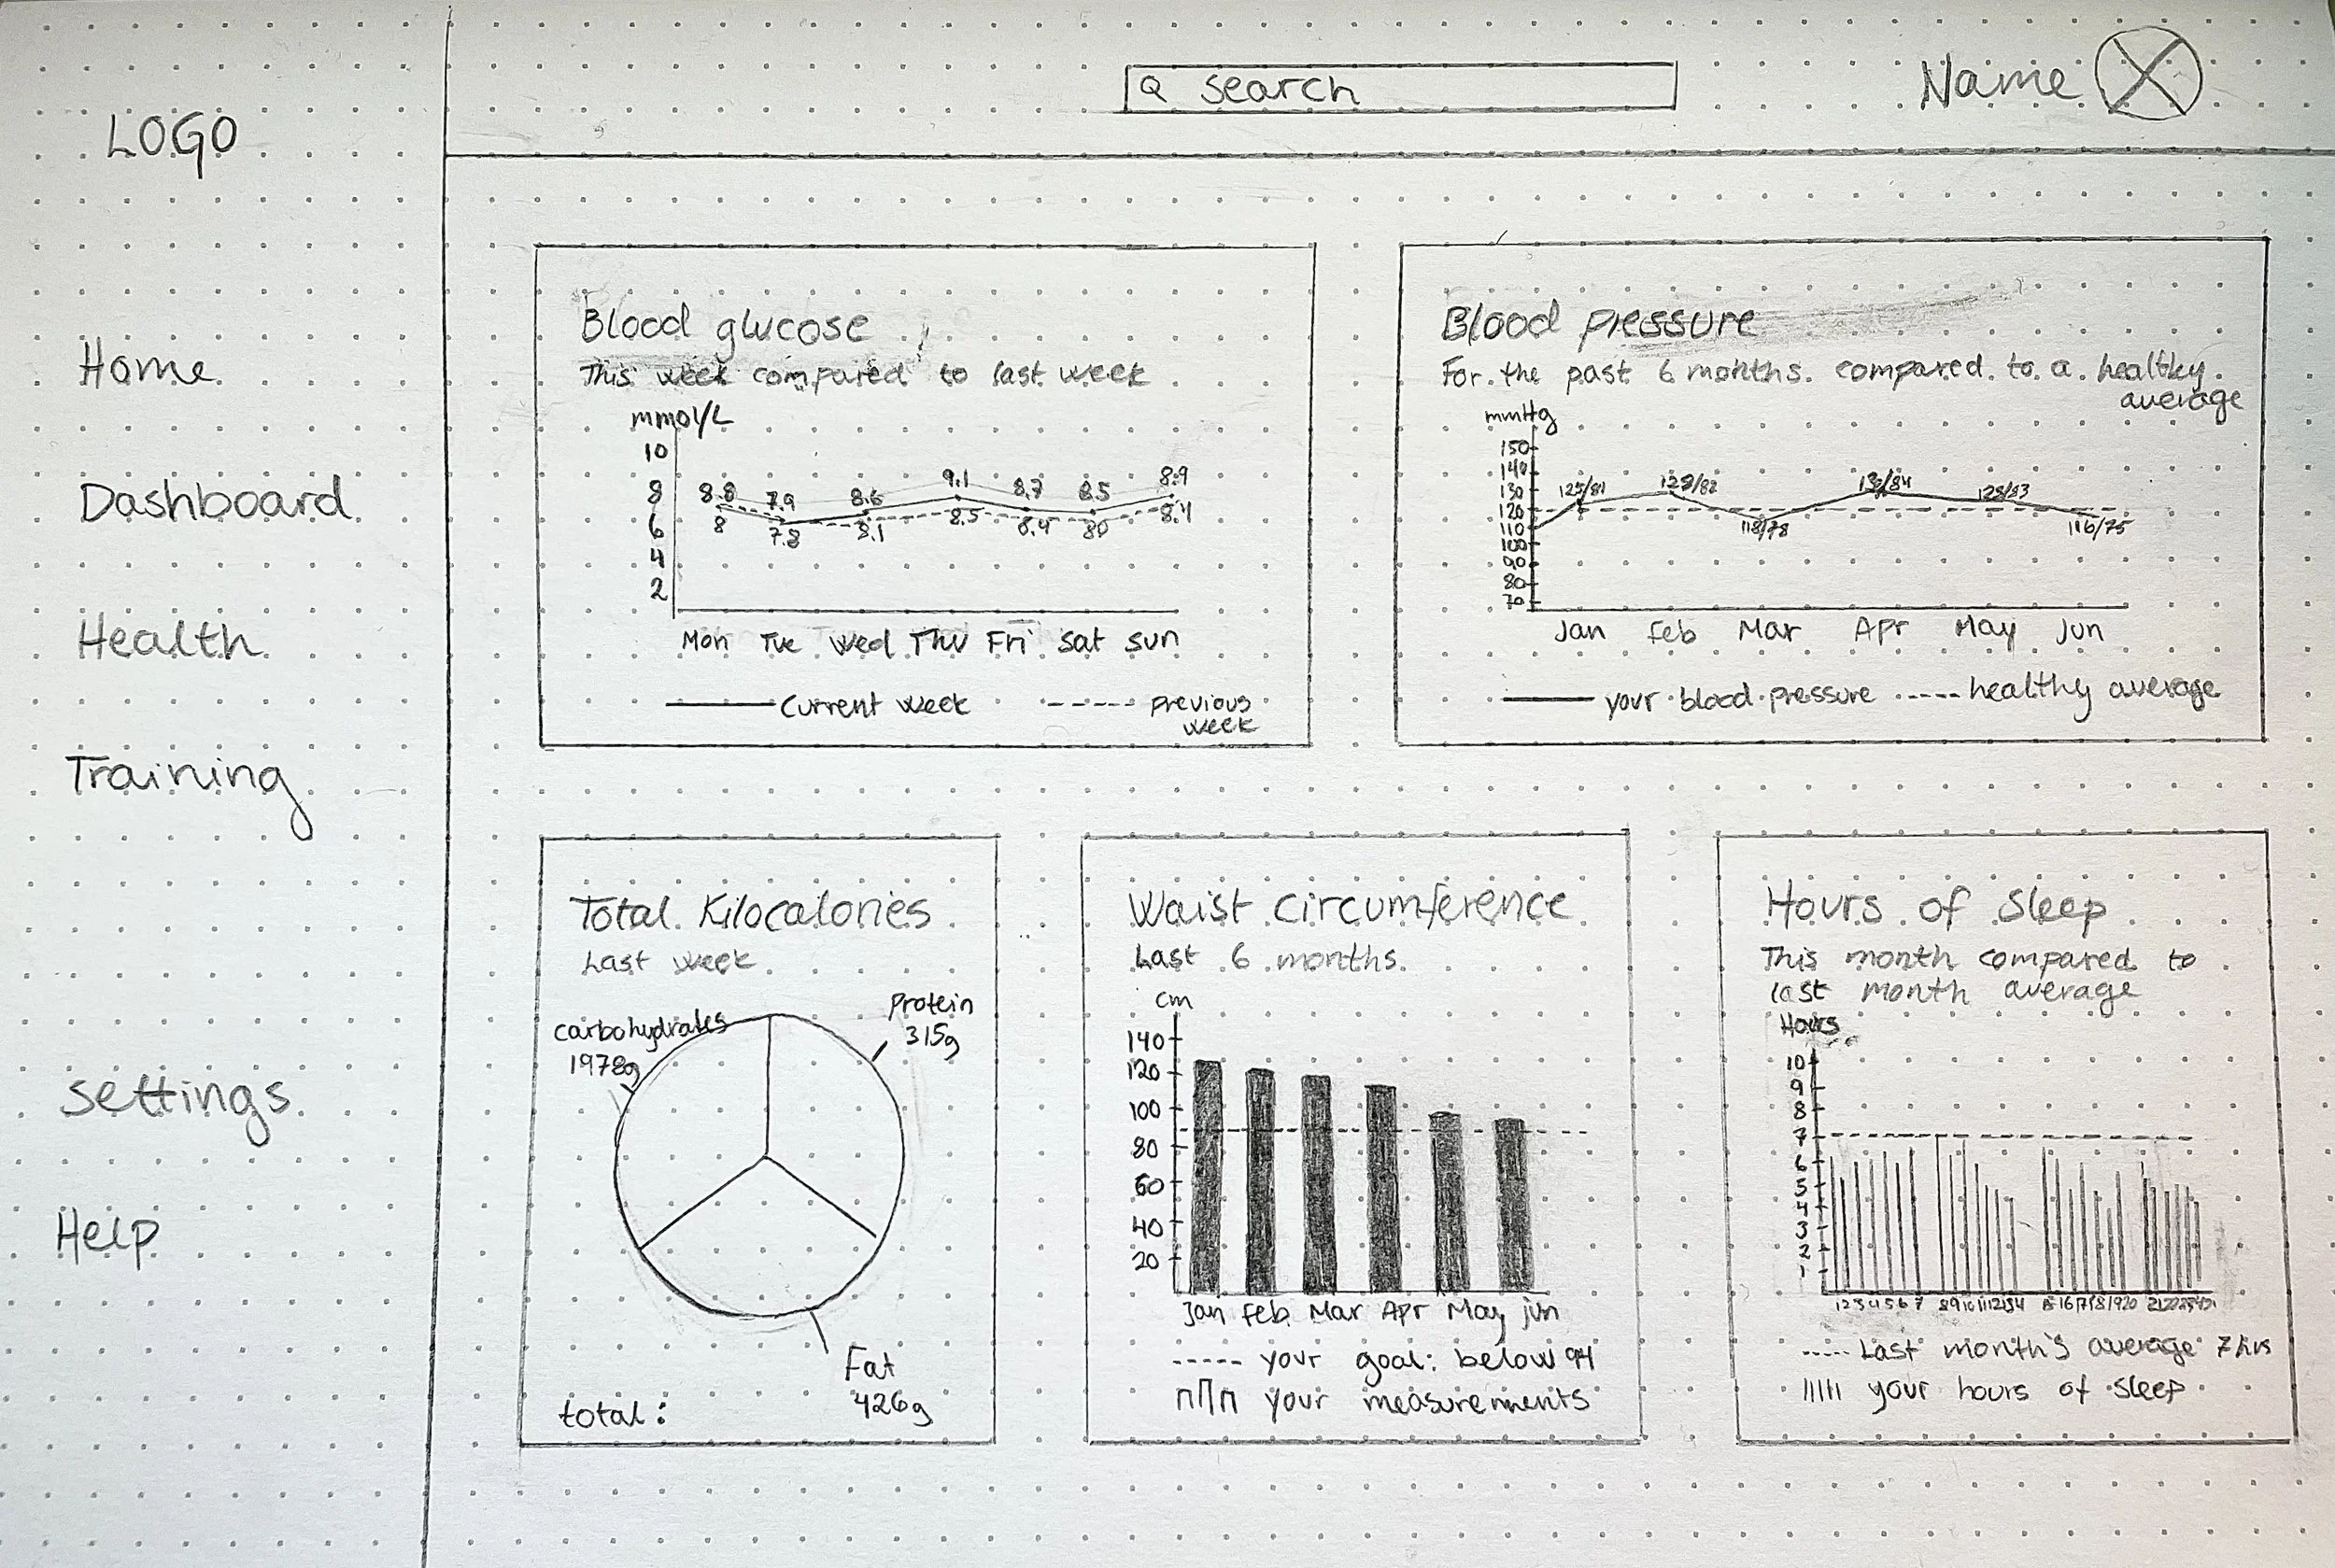
Sketch